Candlestick Charts
Candlestick charts are graphs used in the tracking of prices for certain assets over time. They offer four different points of information for a time period; the opening price, the price high, the price low, and the closing price.
When it comes to reading the price movements of an asset, certain key metrics are needed. One of the most important is a time period, be it hours, days, weeks or even years. A normal price chart would show the opening and closing price in a given time period, and also chart the movements.
However, this is often not enough for traders who are looking for chart patterns in their technical analysis. A candlestick chart is a good tool for traders to use when wanting to understand the price behaviour over a certain time period. It is especially useful for cryptocurrency, as the price volatility can be seen more and understood better with candlesticks.
Because candlestick charts are considered a leading indicator, as opposed to a lagging one, traders can read them with an eye on potential future trends. This can offer a trading edge as patterns emerging in the candlesticks can often lead to expected outcomes occurring.
A candlestick, as the name suggests, is a chart that has a body and a wick - this wick can either face predominantly down in the case of a bear candle, or mostly up in a bull candle. Candlestick charts are thought to have originated from Japanese rice traders in the 18th century. They are still one of the most popular ways of displaying prices of financial markets.
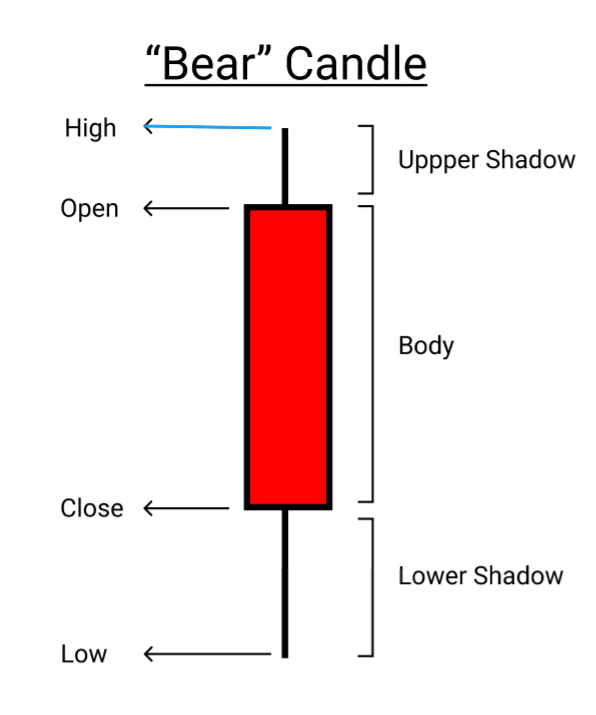
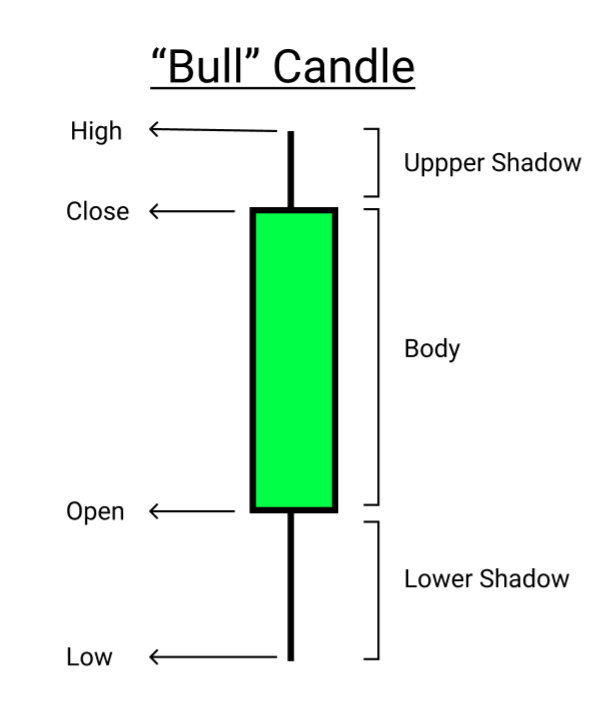
As the images above show, these candles are green or red, indicating if the price of the asset grew or fell in the given time period. When a candle's open price is lower than the close, the candle is said to be bullish, if the opposite happens, then it is a red candle and known as a bear candle.
What is so useful about these charts is that they provide more information than just the price movement in the time period, they show price behaviour. In the given time period, the trader is shown market sentiment via the prominent candle colour, as well as the volatility through the movement of the upper and lower shadows.
Traders are able to use the additional information provided by candlestick graphs to not only get a better gauge of the market sentiment over the time period, but also to unravel patterns for market predicting. By providing bullish or bearish sentiment patterns, traders can assume where the market will be heading, and this is very important in cryptocurrency trading.
Because candlesticks offer raw price data and updates as soon as the given time period is completed, these patterns are said to be "leading" indicators and not "lagging." There are not too many price data points that can offer a forward-looking outcome, but candlesticks do have the potential.