A fakeout refers to a situation in technical chart analysis where a trader enters a situation and takes a position in anticipation of a big price move or technical signal, but that never develops and the asset price does not move as expected leaving the traders stranded.
When it comes to trying to predict the future of an asset or cryptocurrency with regards to its price, one of the best tools at a trader’s disposal is technical chart analysis. However, there is no exact science in that, and oftentimes traders can be stung by following the charts.
Technical chart analysis involves looking for patterns and signs in the movement of the price of an asset or crypto. Similar patterns can often be interpreted to perform in ways seen before. However, the expected outcome of a pattern that emerges is not always certain, and this can lead to a fakeout.
Traders will begin to look for early signs of a pattern — such as a golden cross — expecting the intended outcome to follow. However, perfect chart analysis and movement is not enough to ensure a crypto behaves in a certain way.
When a fakeout does occur, there can be considerable losses for a trader, and it can be devastating. However, the price may reverse very quickly due to outside factors, and the trade can quickly turn into a hefty loss. Many different factors can make the price move against its technical analysis.
As such, in anticipation of a fakeout, many traders will plan their exit strategy and put on stop-loss orders in advance of entering trades. In fact, this is quite a common strategy for basic risk management.
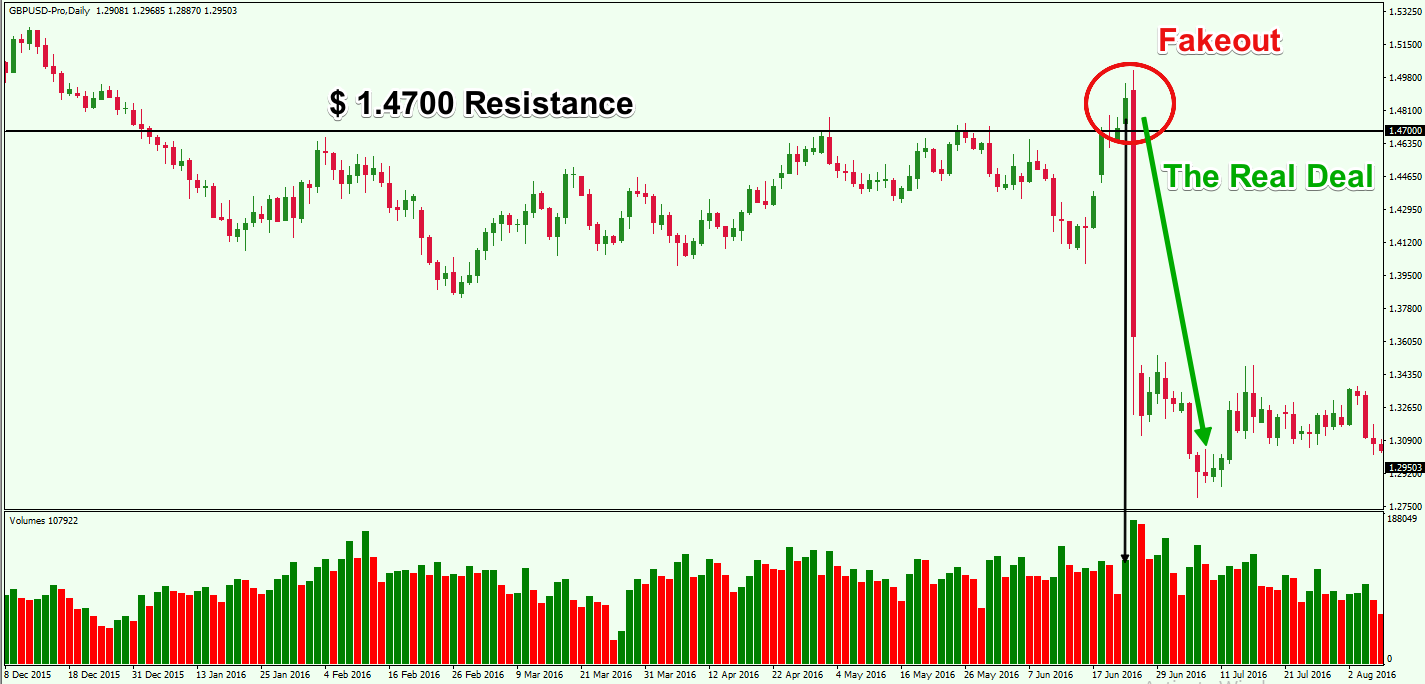
The example above is a fakeout play which shows a resistance level at $1.4700. On the fourth test of the level, the price closes a candle above the $1.4700 resistance – something that has not happened during the previous tests. Many traders would be hopping in on the long side of this trade.
In this case, however, the Volume indicator does not provide a great deal of information. The tiny vertical arrow points to the bar that concerns the respective period.
Nevertheless, the price reverses sharply. The Volume indicator shows an average reading at the moment of the breakout, but it leads to a fakeout pattern. So, even though the Volume indicator is useful, it is not foolproof. Sometimes it helps to move down a timeframe to get a more granular view of price action and see if there is additional supporting evidence of a breakout or fakeout.
Fakeouts can be a real blow for excitable traders who think they have stumbled onto a potentially great pattern. But it is much more important to be aware of the potential for fake outs and to mitigate the losses.
Relying on multiple technical indicators to enter a trade is a good tactic that can help. Technical analysts may set very rigorous requirements for what constitutes a trading signal in their strategy. If one indicator is giving off a signal, it may not be a signal to buy or sell in itself. However, if multiple indicators are saying the same thing, it may confirm the strength of a signal.